contour.
Users are hesitant to shop for clothes online because users are unsure if purchased clothes will fit as desired. Over 40% of all clothing purchased online is returned. For our fourth-year Capstone project, we designed a solution that takes accurate user body measurements and integrates them into the online retail space so that shoppers are comfortable making online clothing purchases. This page provides a brief overview of the design process and the designed solution for the project. A copy of our Capstone symposium poster can be found here.
Members: Ali Vira, Garrett Hardy, Vishal Babu, Allan Meng, Kevin Lau
Design Process
Research was gathered from market studies, scientific papers, and patents. State of the art solutions were tested, and user studies were conducted to establish user requirements and benchmarks. Low-fidelity solutions were constructed and user-tested. The problem was broken down into two parts, acquiring user body measurements, and subsequently integrating those measurements into the online shopping space. A two-part solution was designed and implemented: a 2D body scanning web interface to acquire user measurements, and a Chrome extension to take those user measurements and match them to clothing sizes. The scanning algorithm was user-tested and the resulting data was statistically analyzed.
Surveys
Online retailers and online shoppers were engaged with to substantiate the conclusions drawn from the early research phase, to create benchmarks for the designed solution, and to learn more about the problem space. Online retailer engagement took the form of emails and phone calls, as most of the online retailers being surveyed were unavailable for in-person meetings. Online shopper engagement was conducted through the use of online surveys and in-person interviews.
Fisher’s exact test was used to establish significance of clothes fit to customer satisfaction from the initial survey data. The Fisher test was chosen for two main reasons; the sample size constraint and its ability to form associations between two categorical variables. With a resulting p-value less than 0.05, the Fisher test concluded that customer satisfaction was heavily dependent on well-fitting clothes.
Table 1: Fischer's exact test
| Fit is an issue | Fit is not an issue | Total | |
|---|---|---|---|
| Return purchases | 27 | 3 | 30 |
| Do not return purchases | 4 | 26 | 30 |
| Total | 31 | 29 | 60 |
The two-tailed P value less than 0.001
Objectives
Phase One (acquire user measurements)
- Max of 5% measurement error, 95% of the time
- Max of 5 minutes to obtain measuremetns
Phase Two (integrate user measurements)
- Compy with data privacy regulations
- Maintain a user profile
- Implement a rating/feedback system
- Allow non-baggy clothes during measurement
- Compataible with existing online retail sustems
Low Fidelity Testing
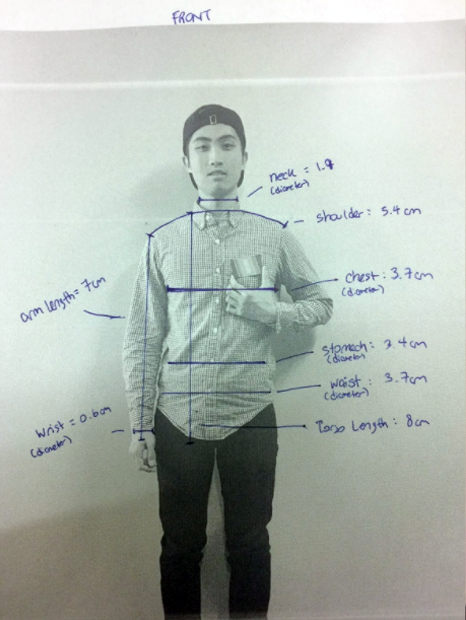
Potential solutions to address the measurement acquisition portion of the problem were devised. Three low-fidelity solutions were created and user-tested on twelve potential customers. The first solution detailed a process whereby a customer would send a tailor an article of clothing that fit as desired, along with other articles of clothing that did not fit as desired. The tailor would modify the ill-fitting garments to match the measurements obtained from the properly-fitting garment. The second solution used a software based 2D body scanning method on two full-body photographs; one front view, and one side view. The user would manually select the contours of the body in each photograph and a black box algorithm would return the user’s body measurements. The third solution augmented the second solution with image recognition so that the user no longer needed to manually define the contours of the body in each photograph.
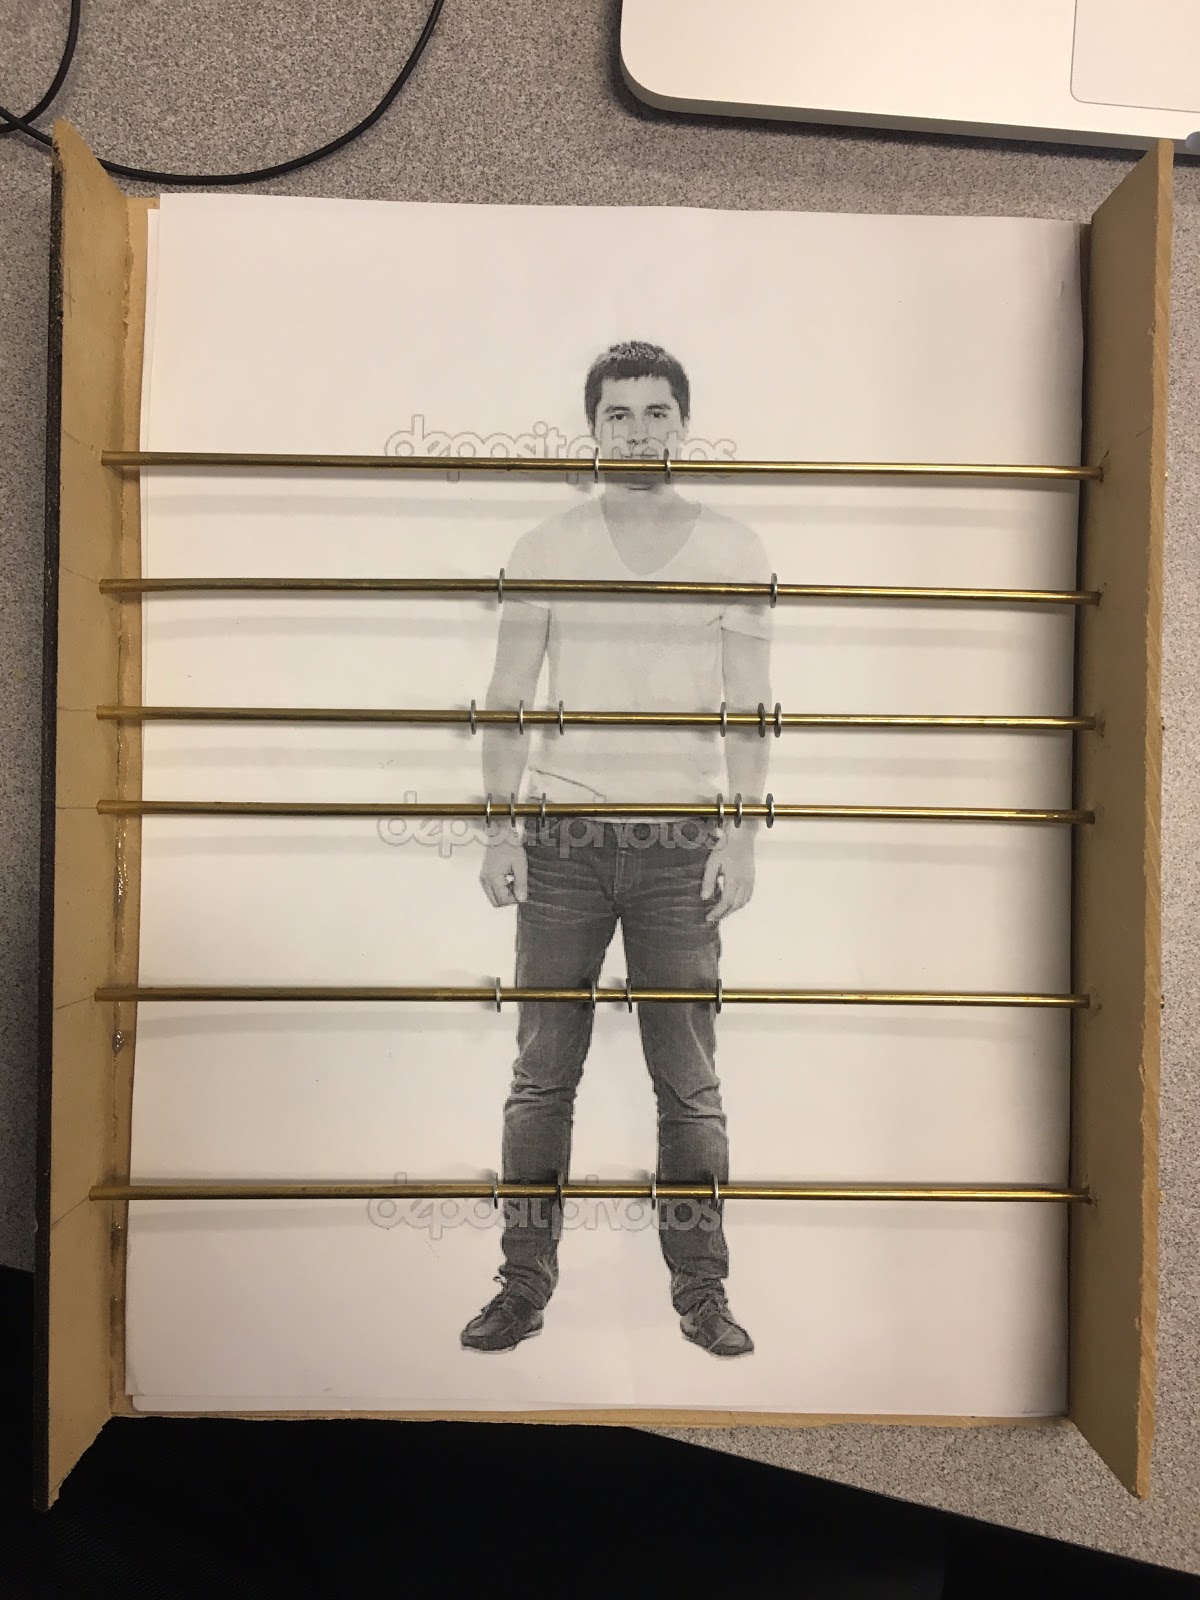
The prototype for the first solution was a storyboard detailing the manual tailoring process. Out of 12 participants, only 58% were interested in the first solution concept. Furthermore, 42% of users would wait no longer than one week to receive their clothes back. The strict wait time made the implementation of the first solution unlikely. The prototype for the second solution was a physical apparatus which approximated a system to manually define contours of key body measurements. 45% of all users stated they would spend no longer than 5 minutes completing all measurements. The prototype for the third solution involved the user taking photos of their body, given requirements to ensure the photos were suitable for an image recognition algorithm. Ultimately, 73% of users favoured the second solution over the third. Furthermore, the second solution was more feasible to implement given time and resource constraints, while still offering the same results as the third solution. Additionally, with 90% of all users were satisfied with spending up to 5 minutes using the system.
Algorithm
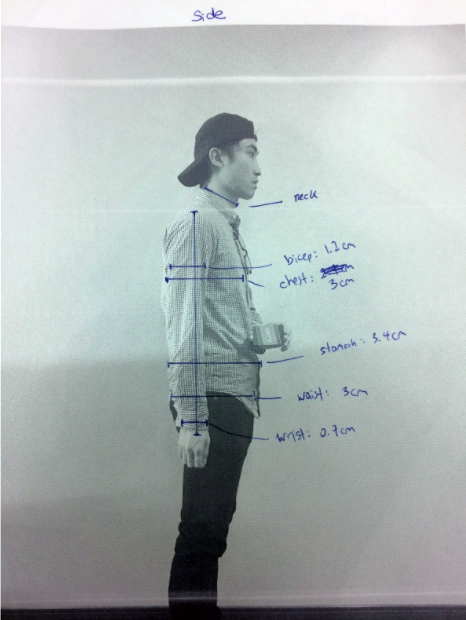
A brute-force methodology was employed to determine if 2D body scanning methods could yield accurate body measurements. Three users were each photographed twice. The first photograph was a full body shot of the user facing the camera while holding a credit card flush with their chest (Appendix Figure 4). The second photograph was a full body side shot with the user holding a credit card at hip-level. By identifying the widths of the neck, chest, and waist from the front view and the side view, and by using the credit card as a scaling tool, the body measurements were successfully calculated by modeling each body segment as the circumference of an ellipse. The measurements produced by manual brute-force analysis were off of the user’s real body measurements by 7% on average. Chest measurements were the most accurate on average, with errors of less than 1%, and neck measurements were the least accurate with an average error of 14% for all participants.
A functional software prototype was then created to mimic the measurement taking process from the validated brute-force testing. Initial user-testing of the functional software prototype was conducted to determine the optimal user position in each photograph to maximize the accuracy of the measurement taking algorithm. User positions included standing close to the camera, standing far away from the camera, tilting the camera up and down, and sitting in front of the camera for the initial two photographs. The seated position was ultimately selected as the optimal way of reducing measurement error.
Statiscal Validation
User-testing was conducted to identify areas of improvement in terms of human factors and to statistically validate the accuracy of the measurement algorithm. Fifteen users were tested for this statistical validation. The first eight users were each manually measured three times then measured by the prototype three times. The remaining users were measured by the prototype first and were manually measured afterwards. This procedure was created to detect and eliminate baseline drift and any bias introduced by knowing measurements beforehand.
Random Block Design was used to conduct a thorough multi-factor analysis of variance on the manual measurement data and the algorithm measurement data for all tested users. This method was chosen to preserve and utilize the fact that measurements are specific to each user, and to fully use the multiple measurement trials. The method also helps eliminate noise and ensures that significantly inaccurate algorithm measurements on opposite sides of the mean do not cancel each other out. With a p-value of 0.477 for the algorithm flag in the multiple regression equation for each measurement, there was insufficient evidence to reject the null hypothesis that the means between the manual measurements and the algorithm measurements were identical for each user.
Table 2: Random Block ANOVA
| Df | Sum Sq | Mean Sq | F value | Pr(>F) | ||
|---|---|---|---|---|---|---|
| Name | 10 | 495.9 | 49.6 | 45.890 | <2e-16 | *** |
| Algorithm | 1 | 0.5 | 0.5 | 0.508 | 0.477 | |
| Body.Part | 2 | 15735.1 | 7867.5 | 7280.741 | <2e-16 | *** |
| Residuals | 172 | 185.9 | 1.1 |
Next, the distribution of error between the algorithm measurements and the manual measurements was investigated. Two categories of users were identified. Novice users were first-time users of the system. Expert users were team members who used the algorithm on the novice user photographs to identify differences. Next, the measurements were converted into a set of binomial data. A measurement from the algorithm within 5% of the actual measurement was counted as a success.
Table 3: Binomial task completion rate summary
| All Measurements | No Baggy Clothing | |||
|---|---|---|---|---|
| Novice | Expert | Novice | Expert | |
| Success | 69 | 93 | 57 | 73 |
| Total | 108 | 135 | 81 | 90 |
| Success Rate | 0.639 | 0.689 | 0.704 | 0.811 |
| Padj | 0.634 | 0.684 | 0.694 | 0.798 |
| Best Point Estimate | 0.639 | 0.689 | 0.704 | 0.811 |
| Exact Binomial P-Value, β=0.95 | 1.000 | 1.000 | 1.000 | 1.000 |
| Exact Binomial P-Value, β=0.78 | 1.000 | 0.995 | 0.960 | 0.285 |
With a p-value of 1.000, and using a 95% confidence level, the null hypothesis that the sample success rate of novice users is less than or equal to the benchmark value of 0.78 should not be rejected. This means that the designed solution fails the benchmark that the algorithm should return a less than 5% error more than 78% of the time. Ultimately, this could have been caused by factors such as poor instructions, baggy clothing, and poor perception of measurement contours. This is illustrated by the fact that the success rates for both novice and expert users increased when users with baggy clothing were eliminated from the data set. Furthermore, expert users performed better at defining contours within the required 5% error. Errors were generally equally distributed among users and among specific measurements. Therefore, such errors could not be compensated within the algorithm itself.
Integration
While the measurement algorithm was being tested, a parallel study was conducted to uncover the optimal way to integrate the functional software prototype into the online shopping space. A survey was sent to male users aged 18 - 35 to reaffirm the rate of dissatisfaction during online shopping and to determine the reasons for that dissatisfaction. Of the twenty users surveyed, more than half shop for clothes online at least 2 times a year. 80% of the surveyed users cited fit as their biggest problem when online shopping. More than 50% of surveyed users did not know their body measurements, and of the remaining users that did, 80% only knew their sizes in terms of the labeled sizes at the stores they regularly shopped at. These observations were used to validate the notions that the majority of male individuals in the 18 - 35 target demographic shop online regularly, that fit is a big issue for users, and that the majority of target users don’t know their inherent body measurements.
An in-person follow-up experiment was conducted on the survey participants. In the first phase of the experiment, participants were made to shop online both with and without a sizing chart and measurements to determine how sizing charts and measurements impacted shopping behaviour. It was found that users were more comfortable shopping online after knowing their body measurements. In the mock shopping trial, users took on average 1 - 3 minutes to select the shirt they wanted without knowing their measurements. This decision time dropped to 10 - 30 seconds after users were told their exact measurements.
In the second phase of the experiment, participants interacted with three different mock interfaces to determine how best to incorporate the measurement taking algorithm into the online shopping process. The first mock interface embedded the measurement taking process on a retailer’s website, giving the retailer the power to serve the customer with appropriately sized clothes. The second mock interface embedded the measurement taking process as a Chrome extension, where the extension would inspect a customer’s cart and inform the customer if a shirt was likely to fit as desired based on a sizing chart database. The last mock interface was a standalone website where a user would complete the measurement acquisition process and clothes matching those measurements would be aggregated from multiple online retailers. 75% of users opted for the Chrome extension interface over the alternatives, citing the ability to browse multiple stores and the flexibility to run the extension when desired as key reasons.
In the final phase of the experiment, participants went through a mock shopping process and were presented with articles of clothing that did not fit as expected to analyze how participants reacted to the surprise and what their expected avenues of recourse were. The majority of interviewed users were shocked enough by receiving an article of clothing that didn’t fit, that most indicated they would be unlikely to shop at the same store again. This observation introduced a feedback and rating mechanism for purchased clothes to the project scope so that customers could identify problem items prior to purchasing and have a voice if the purchase did not turn out as expected.
Final Testing
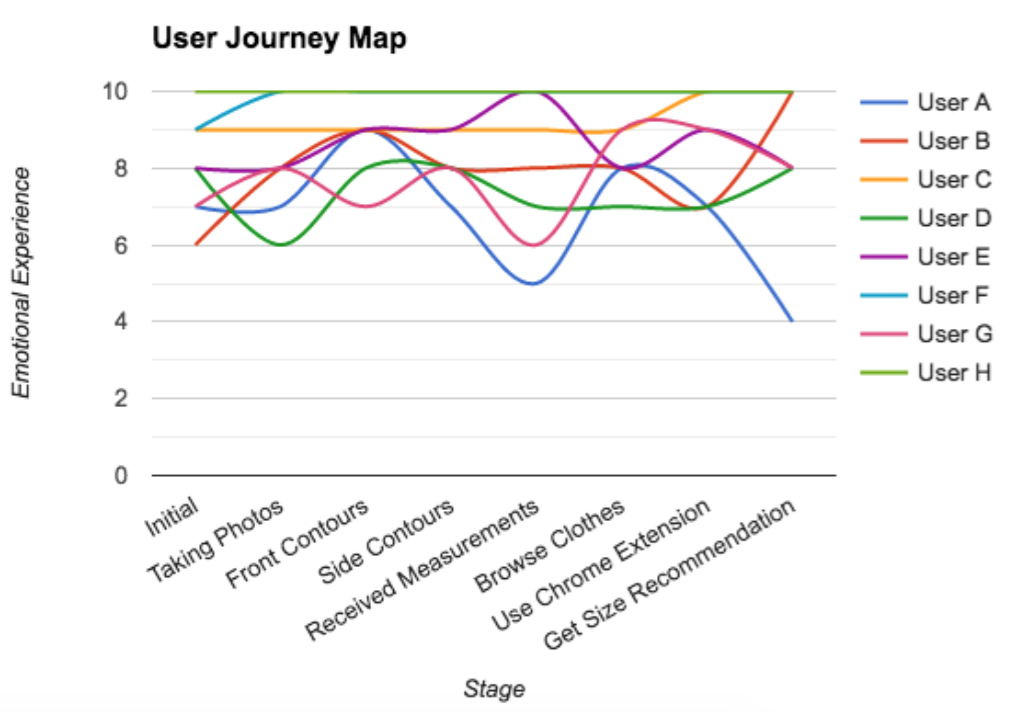
A final round of testing was conducted after the full prototype was developed. The objectives of the final round of testing were to reaffirm that the solution was an improvement of the current online shopping process, to verify customer sentiment throughout the process of using the designed solution, and to make sure that the process met the design benchmarks from earlier phases of the design. Ultimately, users were satisfied with all stages of use and the design satisfied all requirements except for the measurement consistency requirement.
Designed Solution
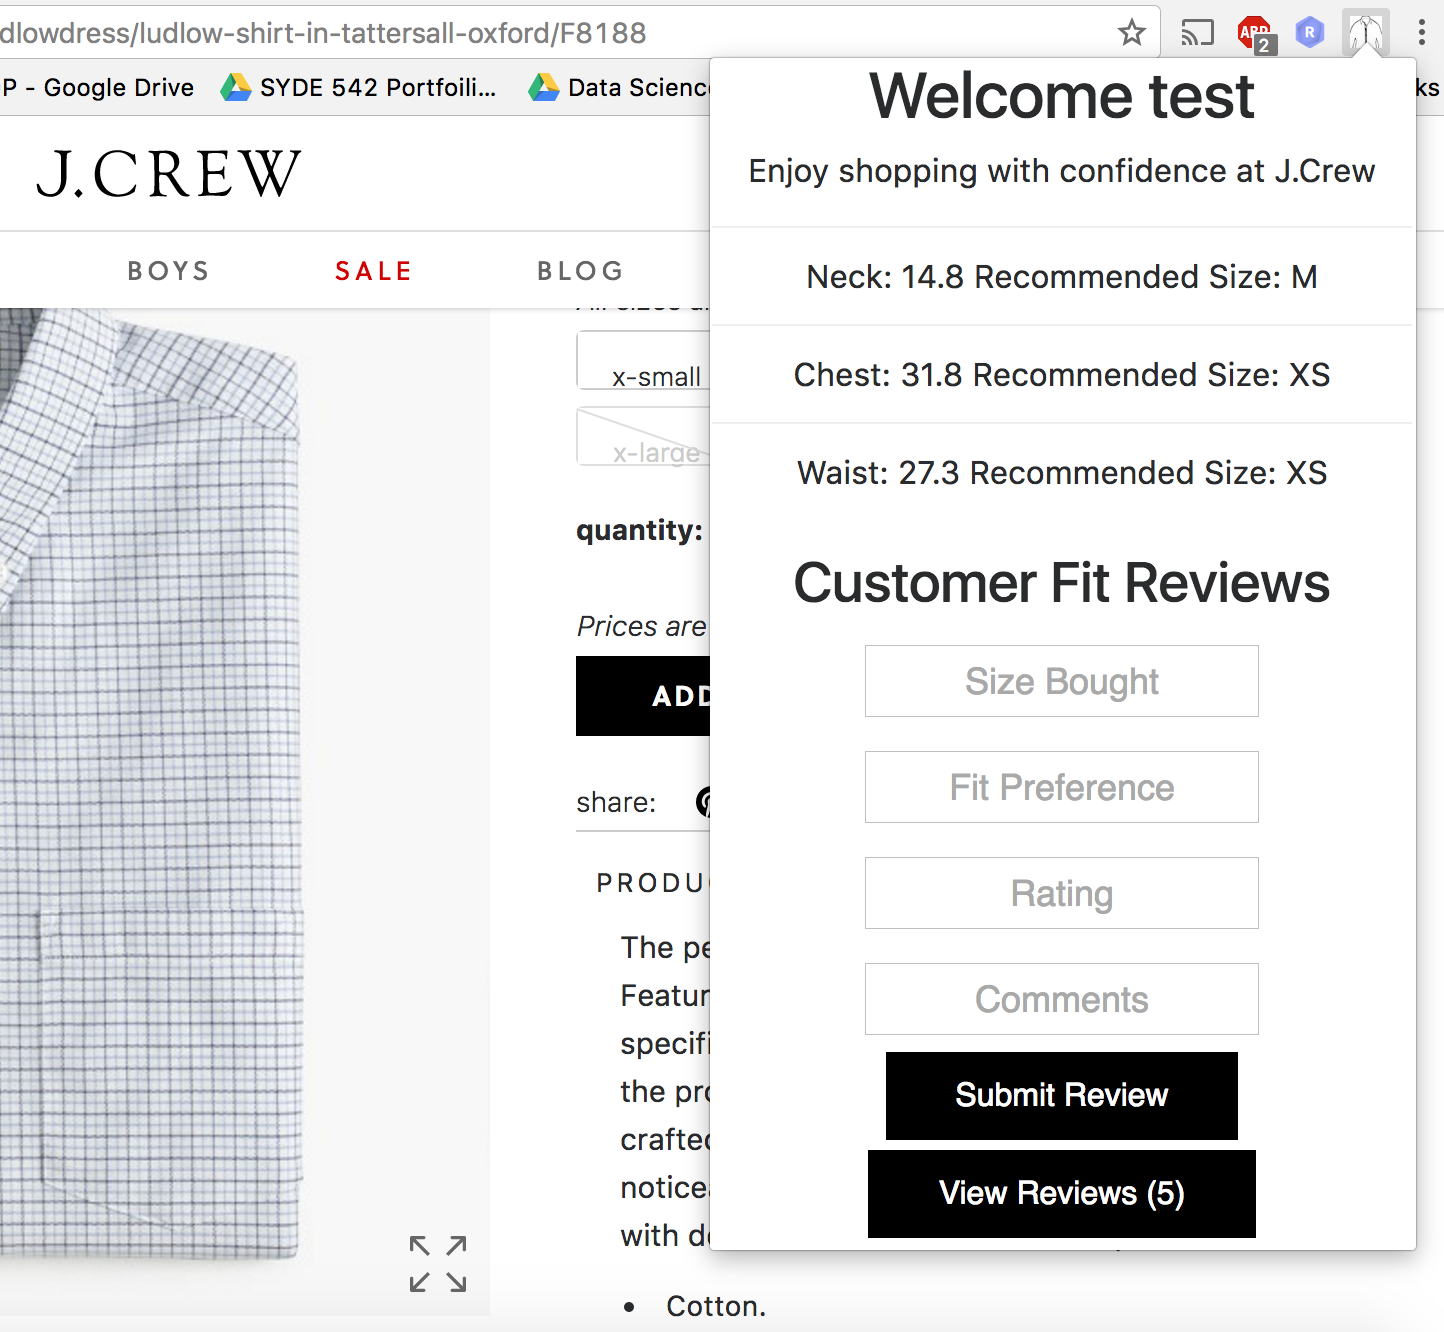
The designed solution exists as a Chrome extension. Creating an account for the first time prompts a user to record their measurements. A user will submit a photograph from the front, and a photograph from the side. The extension will then prompt the user to place digital markers on opposite sides of their neck, chest, and waist respectively. After the extension extrapolates a user's measurements, the user can receive a sizing recommendation based on those measurements from a retailer website by clicking the 'Contour' icon.
A tutorial video outlining the solution is shown below. The github link for the project (which includes some stylstic updates not shown in the video) can be found here.
Below is an updated image of how the sizing recommendation portion of the feature looks